Dear Stakeholder,
We extend our sincere gratitude to our loyal investors for choosing to invest in the Bank’s capital, both equity and debt, and wish to assure that we are determined to optimise returns for your investments through prudent and sustained growth. As one of the four Domestic Systemically Important Banks and the largest private sector Bank in the country, we are cognisant of our responsibility to present you with timely, relevant, and balanced view of the Bank’s fundamentals in terms of operational results, financial position, and cash flows enabling you to make informed decisions. In this regard, we trust that we were able to fulfil the expectations of our valued investors despite the unprecedented operating environment that prevailed during most part of 2021, and assure that we will continue to discharge our responsibilities in future. We trust that the information presented in this Integrated Annual Report helps investors to comprehend the Bank’s underlying strengths and bolster confidence and loyalty, bringing together a loyal group of investors with a long-term value creation for their investment.
As depicted in the section on “Connecting with stakeholders ”, the Bank continuously strives to encourage an effective two-way communication with our valued investors, promoting mutual trust and confidence, whilst ensuring the rights conferred on the investors by various statutes to address the material matters. We firmly believe that these initiatives have enabled the Bank to actively engage with our investors in a consistent, comprehensive and accurate manner, often going beyond the minimum regulations and in the underlying spirit, promoting its reputation.
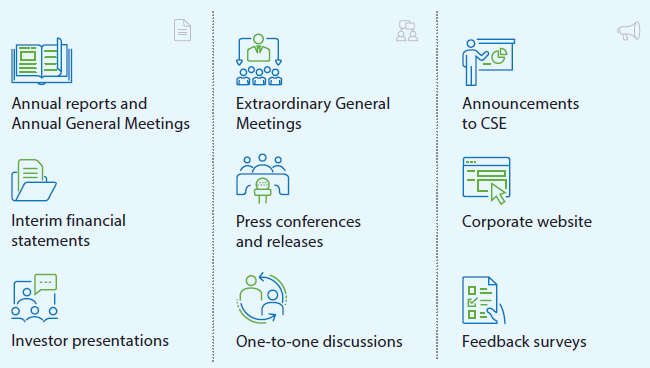
The Bank follows a multi-faceted approach to engage with its stakeholders, including the Annual Report, which is the Bank’s main investor communications tool, and the Annual General Meeting, which is an opportunity available for the investor community to engage with the Bank. We believe that these engagements will certainly help our investors to gain an insight into the Bank’s performance, strategic direction, business model of the Bank, governance mechanism and the risk management strategies adopted.
Continuing with our efforts as in the past, this year too, the Bank took several initiatives to produce an integrated Annual Report in a concise manner. This can be seen throughout each section of this Report, with due consideration being given to the valuable feedback given by our shareholders in response to the surveys conducted and feedback provided in the past. Continuing this journey, this year too, we have made arrangements to enclose an improved stakeholder feedback form in this Annual Report in order to seek your valuable suggestions and opinion for further improvements. Your comments and opinions are of great value to us and we take a very serious note and actions to produce an improved Annual Report, year on year, taking on board many and incorporating into our strategies for long-term value creation to all our stakeholders.
The investor relations section of our website – https://www.combank.lk/financials - is another popular channel available for stakeholders, and the Bank continues to ensure that its pages are updated in a timely manner along with the rest of the site.
Figure – 25 Modes of engagement with Investors
We are confident that the efforts taken by the Bank to have effective communication and active engagement with important stakeholder groups have made the Bank’s shares a creditable investment proposition, despite a very challenging economic and operating environment that prevailed throughout the year due to the continued impact of the COVID-19 pandemic.
Graph – 14: Performance of the Colombo Stock Exchange and the Banking Sector in 2021
Performance of the Colombo Stock Exchange (CSE) in 2021
Year 2021 was the highest record-breaking year for the CSE, with record capital raised by companies and a record number of investor participants. Performance indicators such as market capitalisation, and total and daily average turnover recorded the highest-ever values in 2021. The benchmark All Share Price Index (ASPI) logged a market return of 80.5% and reached 12,226 points by the end of 2021 compared to 6,774 points as at end of 2020, registering the highest return recorded since 2010. Compared with the market indices of the Asia-Pacific region, the ASPI consistently maintained its status as the highest yielding index. The S&P SL20 index followed the ASPI and recorded a return of over 60.5% in 2021, increasing from 2,638 as at end of 2020 to 4,232 by the end of 2021, which is the highest-ever recorded. Market capitalization also reached a 10-year high of 36.7% of GDP or Rs. 5.5 Tn. from 19.7% in 2020 or Rs. 2.96 Tn. and 34.5% in 2010 or Rs. 2.2 Tn.
Performance of the Banking Sector and Commercial Bank shares in 2021
Despite the exemplary performance in both the ASPI and the S&P SL20 indices as shown in the above graph during 2021, the banking sector shares did not follow the same trend. This was mainly due to the perceived uncertainties specific to the sector, which had a direct impact on the performance of banks. They included many relief programs offered to both affected individuals and corporate customers including the extension of moratoriums by the regulator, restrictions imposed on the payment of cash dividends and the Government tax proposals such as the one off income tax payments and the introduction of new taxes. These factors contributed to the decline in the share price of the Bank’s ordinary voting shares, which traded at a discount to its book value at 0.57 times as at end of 2021 (0.60 times as at end of 2020). Nevertheless, it continued to remain the highest among its peers in the banking sector. The Bank index gained marginally by 3.72% during 2021 and stood at 609.15 compared to 587.30 as at end 2020.
The Bank’s public holding (free float) as at December 31, 2021 was 99.77% in voting shares (99.80% in 2020) and 99.86% in non-voting shares (99.84% in 2020), while float-adjusted market capitalisation (compliant under option-1 of the Rules on minimum public holding requirement of the CSE) remained almost at same levels and stood at Rs. 93.981 Bn. (Rs. 93.483 Bn. in 2020). As shown in Table 37, with its shares actively traded in the CSE, investors are provided with a convenient “enter and exit” mechanism. It is pertinent to mention that the number of shareholders holding both voting and non-voting shares of the Bank during the year remained more or less at the same levels, demonstrating the confidence placed by investors in the Bank’s shares despite the challenging conditions experienced during the year 2021.
Compliance report on the contents of the Annual Report in terms of the Listing Rules of the CSE
We are happy to inform you that the Bank has fully complied with all applicable requirements of Section 7.6 of the Listing Rules of the CSE on the contents of the Annual Report and Accounts of a listed entity.
Table 24 given below provides a complete list of disclosure requirements and references to the relevant sections of this Annual Report where the Bank’s compliance with the required disclosures are made together with the relevant page numbers.
The pages that follow contain information on the performance of the Bank’s listed securities.
Table – 24 Compliance with requirements of the Section 7.6 of the Listing Rules of the CSE
| Rule No. | Disclosure requirement | Section/reference | Page/s | |
| 7.6 (i) | Names of persons who during the financial year were Directors of the Bank | Governance and Risk Management | 122 | |
| 7.6 (ii) | Principal activities of the Bank and its subsidiaries during the year and any changes therein | Note 1.3 to the Financial Statements Group Structure | 199 and 200 84 and 85 | |
| 7.6 (iii) | The names and the number of shares held by the 20 largest holders of voting and non-voting shares and the percentage of such shares held | Item 4.2 of the “Investor Relations” | 93 and 94 | |
| 7.6 (iv) | The float adjusted market capitalisation, public holding percentage (%), number of public shareholders and under which option the Bank complies with the minimum public holding requirement, in respect of voting ordinary shares. The public holding percentage (%) in respect of non-voting ordinary Shares. | Item 4.3 of the “Investor Relations” | 94 | |
| 7.6 (v) | A statement of each Directors’ holding and Chief Executive Officer’s holding in shares of the Bank at the beginning and end of the financial year | Item 4.4 of the “Investor Relations” | 94 | |
| 7.6 (vi) | Information pertaining to material foreseeable risk factors of the Bank | Item 5 of the “Investor Relations” | 95 |
| Rule No. | Disclosure requirement | Section/reference | Page/s | |
| 7.6 (vii) | Details of material issues pertaining to employees and industrial relations of the Bank | Item 6 of the “Investor Relations” | 95 | |
| 7.6 (viii) | Extents, locations, valuations and the number of buildings of the Bank’s land holdings and investment properties | Note 39.5 (a) and (b) to the Financial Statements | 261 to 267 | |
| 7.6 (ix) | Number of shares representing the Bank’s stated capital | Note 52 to the Financial Statements Item 7 of the “Investor Relations” | 287 and 288 96 and 97 | |
| 7.6 (x) | A distribution schedule of the number of holders in each class of equity securities, and the percentage of their total holdings as at the end of the year | Item 4.5 of the “Investor Relations” | 95 | |
| 7.6 (xi) | Ratios and market price information: Equity - Dividend per share, dividend payout ratio, net asset value per share, market value per share - highest and lowest values recorded during the financial year and the market value as at the end of financial year - Highest Price, Lowest price, Last traded price Debt - Interest rate of comparable Government Securities, debt/equity ratio, interest cover and quick asset ratio, market prices and yield during the year Any changes in credit rating (for the Bank or any other instrument issued by the Bank) | Items 2, 3 and 11 of the “Investor Relations” Financial Highlights Items 10 and 11 of the “Investor Relations” Item 12 of the “Investor Relations” | 90 to 93 and 99 10 98 and 99 99 | |
| 7.6 (xii) | Significant changes in the Bank’s or its subsidiaries’ fixed assets and the market value of land, if the value differs substantially from the book value | Note 39.5 (b) to the Financial Statements | 263 to 267 | |
| 7.6 (xiii) | Details of funds raised through an Initial Public Offering and/or a further issue of Securities during the year | Note 52 and 52.1 to the Financial Statements The Bank did not raise funds through a share issue during the year. Note 51 to the Financial Statements for the details of debentures issued during the year. Item 10 of the "Investor Relations" | 287 and 288 286 and 287 98 | |
|
| Rule No. | Disclosure requirement | Section/reference | Page/s | |
| 7.6 (xiv) | a. Information in respect of Employee Share Option Schemes - The number of options granted to each category of employees during the financial year. - Total number of options vested but not exercised by each category of employees during the financial year. - Total number of options exercised by each category of employees and the total number of shares arising therefrom during the financial year. - Options cancelled during the financial year and the reasons for such cancellation. - The exercise price. - A declaration by the directors of the Bank confirming that the Bank or any of its subsidiaries has not, directly or indirectly, provided funds for the ESOS. |
_edit-web-resources/image/691.png)
|
Note 53.1 to the Financial Statements | 288 |
| b. Information in respect of Employee Share Purchase Schemes (ESPS) - The total number of shares issued under the ESPS during the financial year - The number of shares issued to each category of employees during the financial year - The price at which the shares were issued to the employees - A declaration by the Directors of the Bank confirming that the Bank or any of its subsidiaries has not, directly or indirectly, provided funds for the ESPS |
_edit-web-resources/image/692.png)
|
Not applicable as the Bank does not have Employee Share Purchase Schemes | – | |
| 7.6 (xv) | Disclosures pertaining to Corporate Governance practices in terms of Rules 7.10.3, 7.10.5 (c) and 7.10.6 (c) of Section 7 of the Rules. | Not applicable since the Bank received an exemption in terms of Section 7.10 (c) of the Listing Rules | – | |
| 7.6 (xvi) | Related party transactions exceeding 10% of the equity or 5% of the total assets of the Bank as per Audited Financial Statements, whichever is lower | The Bank did not have any related party transactions exceeding this threshold during the year 2021 and as at end 2021 ( Note 63.6 to the Financial Statements) | 306 | |
| Details of investments in a related party and/or amounts due from a related party to be set out separately The details shall include, as a minimum: i. The date of the transaction; ii. The name of the related party; iii. The relationship between the Bank and the related party; iv. The amount of the transaction and terms of the transaction; v. The rationale for entering into the transaction. |
_edit-web-resources/image/693.png)
|
Item 20.3 of the Statement of Compliance | 148 |
1. Listed Securities of the Bank
The Bank’s ordinary shares (both voting and non-voting) are listed on the Main Board of the CSE under the ticker symbol “COMB”. All debentures issued are also listed on the CSE. (Refer Table 25 for a summary of listed securities of the Bank).
The Business section of most daily newspapers, including the Daily News, Daily FT, The Island and Daily Mirror carry a summary of trading activity and the daily prices of shares and debentures traded (if any) using the abbreviation of Commercial Bank or COMB.
Summary of listed securities of the Bank Table – 25
|
Number in issue as at
|
Stock symbol
|
||
| December 31, 2021 | December 31, 2020 | ||
| Equity | |||
| Ordinary shares – Voting | 1,124,480,528 | 1,098,934,937 | COMB-N0000 |
| Ordinary shares – Non-voting | 69,740,771 | 67,970,701 | COMB-X0000 |
| Debt | |||
| Fixed rate Debentures March 2016/21 | Redeemed during the year 2021 | 44,303,400 | COMB/BD/08/03/21-C2341-10.75% |
| Fixed rate Debentures October 2016/21 | 50,718,000 | COMB/BD/27/10/21-C2360-12.00% | |
| Fixed rate Debentures March 2016/26 | 17,490,900 | 17,490,900 | COMB/BD/08/03/26-C2342-11.25% |
| Fixed rate Debentures October 2016/26 | 19,282,000 | 19,282,000 | COMB/BD/27/10/26-C2359-12.25% |
| Fixed rate Debentures July 2018/23 | 83,938,400 | 83,938,400 | COMB/BD/22/07/23-C2404-12.00% |
| Fixed rate Debentures July 2018/28 | 16,061,600 | 16,061,600 | COMB/BD/22/07/28-C2405-12.50% |
| Fixed rate Debentures September 2021/26 | 42,374,700 | Issued during the year 2021 | COMB/BD/20/09/26-C2491-09.00% |
| Fixed rate Debentures September 2021/28 | 43,580,000 | COMB/BD/20/09/28-C2492-09.50% | |
Equity Securities
Features of Ordinary Shares Table 26
| Security Type | Quoted Ordinary Shares |
| Listed exchange | Colombo Stock Exchange (CSE) – Main Board |
| Featured stock indices | All Share Price Index (ASPI) |
| Standard & Poor's Sri Lanka 20 (S&P SL20) | |
| GICS Industry Group | Banks |
| CSE stock symbol | Voting - COMB.N0000 |
| Non Voting - COMB.X0000 | |
| International Securities Identification Number (ISIN) | Voting - LK0053N00005 |
| Non Voting - LK0053X00004 |
2. Performance of COMB shares and Returns to Shareholders
The investor interest in the shares of the Bank continued during the year compared to pre-pandemic levels, although there was a decline compared to 2020 due to the unprecedented market performance consequent to the market being closed for almost two months and limiting of the share trading hours. This is reflected in the increased number of transactions (Ordinary shares - Voting 174% and Ordinary shares – Non-Voting 245%) compared to 2019 (Refer Table 31).
The market price of an ordinary voting share of the Bank decreased by 1.98% (a drop of 14.84% in 2020) from Rs. 80.90 at the end of 2020 to Rs. 79.30 at the end of 2021 (Table 29). The Bank continued with its policy of issuing scrip dividends and Employee Share Option Plans. Market capitalisation in terms of Rupees for both voting and non-voting shares remained almost at the same levels (despite there being a reduction in the market capitalisation in terms of US dollars) and stood at Rs. 94.2 Bn. (USD 470.963 Mn.) in 2021 compared to Rs. 93.7 Bn. (USD 500.902 Mn.) in 2020, and accounted for 1.72% of the total market capitalisation as at end of 2021 (3.16% in 2020). The Bank’s shares ranked ninth among all listed entities and first among the listed corporates in the Banking sector. During most of 2021, the movement of the non-voting share price followed the trend of the voting shares.
Graph – 15: Performance of the ordinary shares-voting – 2021
2.1 Movement of COMB Voting Share price over the year Table 27
| Month | Jan-21 | Feb-21 | Mar-21 | Apr-21 | May-21 | Jun-21 | Jul-21 | Aug-21 | Sep-21 | Oct-21 | Nov-21 | Dec-21 |
| Highest Price (Rs.) | 105.00 | 100.00 | 92.50 | 87.30 | 87.30 | 92.30 | 89.00 | 89.60 | 86.20 | 91.20 | 90.00 | 82.90 |
| Lowest Price (Rs.) | 81.00 | 80.00 | 83.00 | 79.00 | 79.00 | 87.00 | 83.00 | 82.60 | 82.00 | 84.50 | 79.90 | 76.90 |
| Price at the month-end (Rs.) | 99.70 | 88.80 | 85.50 | 80.70 | 87.00 | 88.00 | 85.30 | 87.00 | 84.50 | 88.90 | 80.10 | 79.30 |
2.2 Share price movement of last five years Table –28
| 2021 Rs. | 2020 Rs. | 2019 Rs. | 2018 Rs. | 2017 Rs. | |
| Ordinary shares – Voting | |||||
| Highest price during the year | 105.00 | 96.00 | 115.90 | 142.50 | 150.00 |
| Lowest price during the year | 76.90 | 50.00 | 88.60 | 107.50 | 128.50 |
| Last traded price | 79.30 | 80.90 | 95.00 | 115.00 | 135.80 |
| Ordinary shares – Non-voting | |||||
| Highest price during the year | 95.90 | 87.20 | 99.40 | 110.00 | 118.50 |
| Lowest price during the year | 69.60 | 48.00 | 74.00 | 88.00 | 102.30 |
| Last traded price | 72.00 | 70.10 | 83.00 | 95.00 | 105.00 |
Graph – 16: Share price trend – Ordinary Shares – Voting
Graph – 17: Share price trend – Ordinary Shares – Non-Voting
2.3 Sustainable value for investors Table – 29
| Ordinary shares – Voting | Ordinary shares – Non-voting | |||||
| Trade date | 2021 | 2020 | Trade date | 2021 | 2020 | |
| Rs. | Rs. | Rs. | Rs. | |||
| Highest price | 29.01.2021 | 105.00 | 19.01.2021 | 95.90 | ||
| 02.01.2020 | 96.00 | 02.01.2020 | 87.20 | |||
| Lowest price | 23.12.2021 | 76.90 | 22.12.2021 | 69.60 | ||
| 14.05.2020 | 50.00 | 15.05.2020 | 48.00 | |||
| Year-end price | 79.30 | 80.90 | 72.00 | 70.10 | ||
2.4 Information on shareholders’ funds and Bank’s market capitalisation Table–30
| As at December 31, | Shareholders’ funds | Commercial Bank’s market capitalisation (*) | Total market capitalisation of the CSE | Commercial Bank’s market capitalisation as a % of CSE market capitalisation | Commercial Bank’s market capitalisation ranking | Commercial Bank’s market capitalisation (*) |
| Rs. Bn. | Rs. Bn. | Rs. Bn. | % | Rank | USD Mn. | |
| 2021 | 165 | 94 | 5,490 | 1.72 | 9 | 470.963 |
| 2020 | 157 | 94 | 2,961 | 3.16 | 5 | 500.902 |
| 2019 | 133 | 97 | 2,851 | 3.40 | 4 | 532.699 |
| 2018 | 118 | 115 | 2,839 | 4.05 | 3 | 628.415 |
| 2017 | 107 | 133 | 2,899 | 4.60 | 4 | 867.670 |
2.5 Number of share transactions (No.) Table – 31
| 2021 | 2020 | 2019 | 2018 | 2017 | |
| Ordinary shares – Voting | 58,754 | 85,914 | 21,481 | 13,364 | 11,811 |
| Ordinary shares – Non-voting | 18,827 | 21,407 | 5,452 | 4,553 | 4,432 |
2.6 Number of shares traded (No. ‘000) Table – 32
| 2021 | 2020 | 2019 | 2018 | 2017 | |
| Ordinary shares – Voting | 187,853 | 385,017 | 89,289 | 95,286 | 144,205 |
| Ordinary shares – Non-voting | 15,712 | 26,614 | 5,893 | 10,637 | 6,717 |
Graph – 18: Number of share transactions
Graph – 20: Shareholders’ funds and Bank’s market capitalization
Graph – 19: Number of shares traded
3. Dividends
We wish to reiterate that the Bank is fully aware and understands that a declaration of a dividend is fundamental to maintaining a balance between the shareholders’ expectations and the business needs of the Bank. Although the Bank has been paying interim cash dividends up to 2019, the Bank did not pay any interim cash dividends during the past two years. This was in compliance with the requirements of the Banking Act Direction No. 03 of 2021, dated May 13, 2020, Direction No. 01 of 2021 dated January 19, 2021 and Direction No. 11 of 2021 dated July 13, 2021, issued by the CBSL on “Restrictions on Discretionary Payments of Licenced Banks”, wherein licenced banks were instructed to refrain from declaring cash dividends for financial years ended December 31, 2020 and 2021 in view of the possible adverse impact on liquidity and other key performance indicators of banks. However, as per the Banking Act Direction No. 01 of 2021, dated January 19, 2021 and Direction No. 11 of 2021 dated July 13, 2021, issued by the CBSL on the same subject, licenced banks incorporated or established in Sri Lanka were instructed to defer payment of cash dividends until the financial statements for the year ended December 31, 2020 and 2021 are finalised and audited by the external auditors. Accordingly, the Board of Directors of the Bank has now recommended a final dividend of Rs. 7.50 per ordinary share for both ordinary voting and non-voting shares of the Bank. This will be paid in the form of a cash dividend of Rs. 4.50 per share and Rs. 3.00 per share by the issue and allotment of new shares for both voting and non-voting shareholders of the Bank for the year ended December 31, 2021. This proposed first and final dividend for the year 2021 will be submitted for the approval of the shareholders at the 53rd AGM, to be held on March 30, 2022.
(A dividend of Rs. 6.50 per share was declared and paid by the Bank for the year ended December 31, 2020. It consisted of a cash dividend of Rs. 4.50 per share and balance entitlement of Rs. 2.00 per share satisfied in the form of an issue and allotment of new shares).
3.1 Dividend information Table – 33
| Dividends | 2021 | 2020 | 2019 | 2018 | 2017 |
|
Cash – Rs. Per share |
|||||
| First interim paid | – | – | 1.50 | 1.50 | 1.50 |
| Second interim paid | – | – | 3.00 | 3.00 | 3.00 |
| Final proposed | 4.50 | 4.50 | – | – | – |
|
Total |
4.50 | 4.50 | 4.50 | 4.50 | 4.50 |
|
Scrip – Rs. Per share |
|||||
| Final proposed/allotted | 3.00 | 2.00 | 2.00 | 2.00 | 2.00 |
|
Total |
7.50 | 6.50 | 6.50 | 6.50 | 6.50 |
|
Gross Dividend paid (Rs. Bn.) |
|||||
| Cash | 5.37 | 5.25 | 4.62 | 4.55 | 4.48 |
| Scrip | 3.58 | 2.34 | 2.06 | 2.02 | 2.00 |
|
Total |
8.95 | 7.59 | 6.68 | 6.57 | 6.48 |
|
Dividend payout ratio (%) |
|||||
| Cash | 22.77 | 32.07 | 27.16 | 25.92 | 26.42 |
| Cash and Shares | 37.94 | 46.33 | 39.23 | 37.44 | 38.17 |
Graph – 21: Dividend per share
Graph – 22: Distribution to shareholders (Dividend paid) and Dividend pay-out ratio
4. Shareholders
The Bank had 16,609 ordinary voting shareholders and 5,954 ordinary non-voting shareholders as at December 31, 2021, compared to 16,820 and 5,786 voting and non-voting shareholders as at December 31, 2020 (Table 34). With three new investors joining ranks, the percentage of ordinary voting shares held by the 20 largest shareholders as at end 2021 increased to 74.22% from 71.96% as at end 2020. However, a marginal drop was witnessed in the non-voting ordinary shares held by the 20 largest shareholders from 38.22% as at end 2020 to 37.69% as at end 2021.
4.1 Number of ordinary shareholders Table – 34
| As at December 31, | 2021 | 2020 |
| Ordinary shareholders – Voting | 16,609 | 16,820 |
| Ordinary shareholders – Non-voting | 5,954 | 5,786 |
|
Total |
22,563 | 22,606 |
4.2 The names, number of shares and percentages of shares held by the twenty largest shareholders (As per rule No. 7.6 (iii) of the Listing Rules of the CSE) Voting shareholders Table – 35
| As at December 31, | 2021 | 2020* | |||
| Ordinary shares – Voting | Number of shares | % | Number of shares | % | |
| 1. | DFCC Bank PLC A/C 1 | 136,272,121 | 12.12 | 132,119,619 | 12.02 |
| 2. | Mr Y S H I Silva | 111,100,779 | 9.88 | 97,441,255 | 8.87 |
| 3. | Employees Provident Fund | 96,883,940 | 8.62 | 94,723,763 | 8.62 |
| 4. | CB NY S/A International Finance Corporation | 79,992,025 | 7.11 | 78,208,480 | 7.12 |
| 5. | Sri Lanka Insurance Corporation Ltd. - Life Fund | 56,747,851 | 5.05 | 61,403,691 | 5.59 |
| 6. | Melstacorp PLC | 46,521,219 | 4.14 | 45,483,957 | 4.14 |
| 7. | CB NY S/A IFC Emerging Asia Fund LP | 41,238,490 | 3.67 | 40,319,015 | 3.67 |
| 8. | CB NY S/A IFC Financial Institutions Growth Fund LP | 41,238,490 | 3.67 | 40,319,015 | 3.67 |
| 9. | Citibank Newyork S/A Norges Bank Account 2 | 40,824,369 | 3.63 | 45,759,984 | 4.16 |
| 10. | Sri Lanka Insurance Corporation Ltd. - General Fund | 39,793,725 | 3.54 | 38,906,463 | 3.54 |
| 11. | Mr K D D Perera | 35,623,143 | 3.17 | – | – |
| 12. | Mr D P Pieris | 26,696,174 | 2.37 | 21,003,054 | 1.91 |
| 13. | Employees Trust Fund Board | 19,586,019 | 1.74 | 19,159,319 | 1.74 |
| 14. | Renuka Hotels PLC | 11,118,680 | 0.99 | 9,893,069 | 0.90 |
| 15. | Mr M J Fernando | 10,108,137 | 0.90 | 9,882,761 | 0.90 |
| 16. | Mrs L E M Yaseen | 10,000,000 | 0.89 | 17,077,784 | 1.55 |
| 17. | Renuka Consultants & Services Limited | 8,935,921 | 0.79 | 8,631,578 | 0.79 |
| 18. | Cargo Boat Development Company PLC | 8,017,215 | 0.71 | 4,389,182 | 0.40 |
| 19. | Hallsville Trading Group INC. | 7,876,387 | 0.70 | 7,564,706 | 0.69 |
| 20. | Mr S V Somasunderam | 6,001,380 | 0.53 | – | – |
| Sub total | 834,576,065 | 74.22 | 772,286,695 | 70.28 | |
| Other shareholders | 289,904,463 | 25.78 | 326,648,242 | 29.72 | |
|
Total |
1,124,480,528 | 100.00 | 1,098,934,937 | 100.00 | |
Non-voting shareholders Table – 36
| As at December 31, | 2021 | 2020* | |||
| Ordinary shares – Non-voting | Number of shares | % | Number of shares | % | |
| 1. | Employees Trust Fund Board | 5,425,375 | 7.78 | 5,287,676 | 7.78 |
| 2. | Akbar Brothers (Pvt) Ltd. A/C No 1 | 3,345,296 | 4.80 | 3,117,457 | 4.59 |
| 3. | GF Capital Global Limited | 1,803,067 | 2.59 | 1,757,304 | 2.59 |
| 4. | Mr A H Munasinghe | 1,694,141 | 2.43 | 1,651,143 | 2.43 |
| 5. | Mr M F Hashim | 1,362,616 | 1.95 | 1,282,270 | 1.89 |
| 6. | M J F Exports (Pvt) Ltd. | 1,193,037 | 1.71 | 1,162,757 | 1.71 |
| 7. | Janashakthi Insurance PLC - Shareholders | 1,098,757 | 1.58 | – | – |
| 8. | Mrs L V C Samarasinha | 1,052,622 | 1.51 | 1,025,906 | 1.51 |
| 9. | Saboor Chatoor (Pvt) Ltd. | 997,913 | 1.43 | 947,600 | 1.39 |
| 10. | Deutsche Bank AG As Trustee To Assetline Income Plus Growth Fund | 899,345 | 1.29 | 1,770,354 | 2.60 |
| 11. | Mr T W A Wickramasinghe, Mrs N Wickramasinghe (Joint) | 859,923 | 1.23 | 780,000 | 1.15 |
| 12. | Mr E Chatoor | 825,963 | 1.18 | 805,000 | 1.18 |
| 13. | Mr J G De Mel | 780,974 | 1.12 | 590,000 | 0.87 |
| 14. | Mr R Gautam | 745,897 | 1.07 | 708,999 | 1.04 |
| 15. | Mr J D Bandaranayake, Ms N Bandaranayake & Dr V Bandaranayake (Joint) | 742,382 | 1.06 | 723,540 | 1.06 |
| 16. | Mr J D Bandaranayake, Dr V Bandaranayake & Ms I Bandaranayake (Joint) | 720,767 | 1.03 | 702,474 | 1.03 |
| 17. | Mr A L Gooneratne | 718,873 | 1.03 | 500,628 | 0.74 |
| 18. | Mr K S M De Silva | 706,366 | 1.01 | 626,249 | 0.92 |
| 19. | Mr M J Fernando | 685,247 | 0.98 | 801,511 | 1.18 |
| 20. | Serendip Investments Limited | 635,881 | 0.91 | 1,167,646 | 1.72 |
| Sub total | 26,294,442 | 37.69 | 25,408,514 | 37.38 | |
| Other shareholders | 43,446,329 | 62.31 | 42,562,187 | 62.62 | |
|
Total |
69,740,771 | 100.00 | 67,970,701 | 100.00 | |
4.3 Public Shareholding (As per rule No. 7.6 (iv) and 7.13.1 of the Listing Rules of the CSE) Table – 37
| 2021 | 2020 | |||
| Number | % | Number | % | |
| Number of Shareholders representing the public holding (Voting) | 16,569 | 99.77 | 16,785 | 99.80 |
| Number of Shareholders representing the public holding (Non-voting) | 5,949 | 99.86 | 5,781 | 99.84 |
| Float Adjusted Market Capitalization Rs. Bn. - (Compliant under Option 1) | 94 | 93 | ||
4.4 Directors’ shareholding including the Chief Executive Officer’s shareholding (As per Rule No. 7.6 (v) of the Listing Rules of the CSE) Table – 38
| Ordinary shares – Voting | Ordinary shares – Non-voting | |||
| 2021 | 2020 | 2021 | 2020 | |
| Justice K Sripavan - Chairman | 14,319 | 14,000 | Nil | Nil |
| Prof A K W Jayawardane - Deputy Chairman | 13,083 | 12,792 | Nil | Nil |
| Mr S Renganathan - Managing Director/Group Chief Executive Officer | 432,336 | 362,010 | 12,781 | 12,457 |
| Mr S C U Manatunge | 73,038 | 71,410 | Nil | Nil |
| Mr K Dharmasiri | Nil | Nil | Nil | Nil |
| Mr L D Niyangoda | Nil | Nil | Nil | Nil |
| Ms N T M S Cooray | 350,274 | 342,465 | 54,251 | 52,875 |
| Mr T L B Hurulle | Nil | Nil | Nil | Nil |
| Ms J Lee | Nil | Nil | Nil | Nil |
| Mr R Senanayake | Nil | Nil | Nil | Nil |
| Mr Sharhan Muhseen * | 2,503 | 2,448 | Nil | Nil |
| Mrs D L T S Wijewardena** | Nil | Nil | Nil | Nil |
4.5 Distribution schedule of number of holders and percentage of holding in each class of equity securities (As per rule No. 7.6 (x) of the Listing Rules of the CSE) Table – 39
| As at December 31, 2021 | As at December 31, 2020 | |||||||
| Number of shareholders | % | Number of shares | % | Number of shareholders | % | Number of shares | % | |
| Ordinary shares – Voting | ||||||||
| 1 – 1,000 | 9,159 | 55.14 | 2,197,203 | 0.20 | 8,801 | 52.32 | 2,308,178 | 0.21 |
| 1,001 – 10,000 | 5,004 | 30.13 | 17,389,250 | 1.55 | 5,441 | 32.35 | 19,304,413 | 1.76 |
| 10,001 – 100,000 | 2,032 | 12.23 | 57,783,364 | 5.14 | 2,139 | 12.72 | 60,718,288 | 5.53 |
| 100,001 – 1,000,000 | 340 | 2.05 | 89,545,274 | 7.96 | 364 | 2.16 | 95,838,529 | 8.72 |
| Over 1,000,000 | 74 | 0.45 | 957,565,437 | 85.15 | 75 | 0.45 | 920,765,529 | 83.78 |
|
Total |
16,609 | 100.00 | 1,124,480,528 | 100.00 | 16,820 | 100.00 | 1,098,934,937 | 100.00 |
| Ordinary shares – Non-voting | ||||||||
| 1 – 1,000 | 3,306 | 55.53 | 810,801 | 1.16 | 3,161 | 54.63 | 810,631 | 1.19 |
| 1,001 – 10,000 | 1,885 | 31.66 | 6,514,550 | 9.34 | 1,863 | 32.20 | 6,341,366 | 9.33 |
| 10,001 – 100,000 | 653 | 10.97 | 17,992,665 | 25.80 | 654 | 11.30 | 18,176,361 | 26.74 |
| 100,001 – 1,000,000 | 102 | 1.71 | 27,447,844 | 39.36 | 99 | 1.71 | 24,419,830 | 35.93 |
| Over 1,000,000 | 8 | 0.13 | 16,974,911 | 24.34 | 9 | 0.16 | 18,222,513 | 26.81 |
|
Total |
5,954 | 100.00 | 69,740,771 | 100.00 | 5,786 | 100.00 | 67,970,701 | 100.00 |
4.6 Composition of shareholders Table – 40
| As at December 31, 2021 | As at December 31, 2020 | |||||||
| No. of shareholders | % | No. of shares | % | No. of shareholders | % | No. of shares | % | |
| Ordinary shares – Voting | ||||||||
| Resident | 16,353 | 98.46 | 892,930,537 | 79.41 | 16,534 | 98.30 | 838,880,863 | 76.34 |
| Non-resident | 256 | 1.54 | 231,549,991 | 20.59 | 286 | 1.70 | 260,054,074 | 23.66 |
|
Total |
16,609 | 100.00 | 1,124,480,528 | 100.00 | 16,820 | 100.00 | 1,098,934,937 | 100.00 |
| Individuals | 15,895 | 95.70 | 350,776,984 | 31.19 | 16,096 | 95.70 | 301,468,333 | 27.43 |
| Institutions | 714 | 4.30 | 773,703,544 | 68.81 | 724 | 4.30 | 797,466,604 | 72.57 |
|
Total |
16,609 | 100.00 | 1,124,480,528 | 100.00 | 16,820 | 100.00 | 1,098,934,937 | 100.00 |
| Ordinary shares – Non-voting | ||||||||
| Resident | 5,883 | 98.81 | 65,580,173 | 94.03 | 5,707 | 98.63 | 63,316,978 | 93.15 |
| Non-resident | 71 | 1.19 | 4,160,598 | 5.97 | 79 | 1.37 | 4,653,723 | 6.85 |
|
Total |
5,954 | 100.00 | 69,740,771 | 100.00 | 5,786 | 100.00 | 67,970,701 | 100.00 |
| Individuals | 5,699 | 95.72 | 46,434,683 | 66.58 | 5,537 | 95.70 | 45,572,024 | 67.05 |
| Institutions | 255 | 4.28 | 23,306,088 | 33.42 | 249 | 4.30 | 22,398,677 | 32.95 |
|
Total |
5,954 | 100.00 | 69,740,771 | 100.00 | 5,786 | 100.00 | 67,970,701 | 100.00 |
5. Material foreseeable risk factors (As per Rule No. 7.6 (vi) of the Listing Rules of the CSE)
Information pertaining to the material foreseeable risk factors, that require disclosures as per Rule No. 7.6 (vi) of the Listing Rules of the CSE is discussed in the Section on “Risk Governance and Management ”.
6. Material issues pertaining to employees and industrial relations pertaining to the Bank (As per Rule No. 7.6 (vii) of the Listing Rules of the CSE)
During the year under review, there were no material issues relating to employees and industrial relations pertaining to the Bank, which warrant disclosure.
7. Information on movement in number of shares represented by the stated capital (As per rule No.7.6 (ix) of the Listing Rules of the CSE) Table – 41
| Number of shares | |||||||
| Year | Basis | Number of shares issued/ (redeemed) | Ordinary shares voting | Ordinary shares non-voting | Cumulative redeemable preference shares | ||
| 1987 | As at December 31, 1987 | 3,000,000 | – | – | |||
| 1988 | Bonus issue | Voting | 2 for 3 | 2,000,000 | 5,000,000 | – | – |
| 1990 | Bonus issue | Voting | 1 for 1 | 5,000,000 | 10,000,000 | – | – |
| 1993 | Rights issue | Voting | 1 for 4 | 2,500,000 | 12,500,000 | – | – |
| 1996 | Bonus issue | Voting | 3 for 5 | 7,500,000 | 20,000,000 | – | – |
| Rights issue | Voting | 1 for 4 | 5,000,000 | 25,000,000 | – | – | |
| Share swap | Non-voting | 894,275 | 25,000,000 | 894,275 | – | ||
| Bonus issue | Non-voting | 3 for 5 | 536,565 | 25,000,000 | 1,430,840 | – | |
| Rights issue | Non-voting | 1 for 4 | 357,710 | 25,000,000 | 1,788,550 | – | |
| 1998 | Bonus issue | Voting | 3 for 10 | 7,500,000 | 32,500,000 | 1,788,550 | – |
| Bonus issue | Non-voting | 3 for 10 | 536,565 | 32,500,000 | 2,325,115 | – | |
| 2001 | Bonus issue | Voting | 1 for 5 | 6,500,000 | 39,000,000 | 2,325,115 | – |
| Bonus issue | Non-voting | 1 for 5 | 465,023 | 39,000,000 | 2,790,138 | – | |
| Issue of cumulative redeemable preference shares | 90,655,500 | 39,000,000 | 2,790,138 | 90,655,500 | |||
| 2003 | Bonus issue | Voting | 1 for 3 | 13,000,000 | 52,000,000 | 2,790,138 | 90,655,500 |
| Rights issue | Voting | 1 for 4 | 13,000,000 | 65,000,000 | 2,790,138 | 90,655,500 | |
| Bonus issue | Non-voting | 1 for 3 | 930,046 | 65,000,000 | 3,720,184 | 90,655,500 | |
| Rights issue | Non voting | 1 for 4 | 930,046 | 65,000,000 | 4,650,230 | 90,655,500 | |
| Issue of cumulative redeemable preference shares | 100,000,000 | 65,000,000 | 4,650,230 | 190,655,500 | |||
| 2004 | ESOP | Voting | 29,769 | 65,029,769 | 4,650,230 | 190,655,500 | |
| 2005 | ESOP | Voting | 1,361,591 | 66,391,360 | 4,650,230 | 190,655,500 | |
| Bonus issue | Voting | 1 for 1 | 66,389,162 | 132,780,522 | 4,650,230 | 190,655,500 | |
| Bonus issue | Non-voting | 1 for 1 | 4,650,230 | 132,780,522 | 9,300,460 | 190,655,500 | |
| 2006 | ESOP | Voting | 737,742 | 133,518,264 | 9,300,460 | 190,655,500 | |
| Redemption of cumulative redeemable preference shares | (90,655,500) | 133,518,264 | 9,300,460 | 100,000,000 | |||
| 2007 | Rights issue | Voting | 3 for 10 | 40,288,996 | 173,807,260 | 9,300,460 | 100,000,000 |
| Bonus issue | Voting | 1 for 3 | 58,204,268 | 232,011,528 | 9,300,460 | 100,000,000 | |
| ESOP | Voting | 919,649 | 232,931,177 | 9,300,460 | 100,000,000 | ||
| Rights issue | Non-voting | 3 for 10 | 2,790,138 | 232,931,177 | 12,090,598 | 100,000,000 | |
| Bonus issue | Non-voting | 1 for 3 | 4,030,199 | 232,931,177 | 16,120,797 | 100,000,000 | |
| 2008 | Redemption of cumulative redeemable preference shares | (100,000,000) | 232,931,177 | 16,120,797 | – | ||
| ESOP | Voting | 350,049 | 233,281,226 | 16,120,797 | – | ||
| 2009 | ESOP | Voting | 540,045 | 233,821,271 | 16,120,797 | – | |
| 2010 | Share split | Voting | 1 for 2 | 117,402,608 | 351,223,879 | 16,120,797 | – |
| Share split | Non-voting | 1 for 2 | 8,060,398 | 351,223,879 | 24,181,195 | – | |
| ESOP | Voting | 2,081,508 | 353,305,387 | 24,181,195 | – | ||
| 2008 | Redemption of cumulative redeemable preference shares | (100,000,000) | 232,931,177 | 16,120,797 | – | ||
| ESOP | Voting | 350,049 | 233,281,226 | 16,120,797 | – | ||
| 2009 | ESOP | Voting | 540,045 | 233,821,271 | 16,120,797 | – | |
| Number of shares | ||||||||
| Year | Basis | Number of shares issued/ (redeemed) | Ordinary shares voting | Ordinary shares non-voting | Cumulative redeemable preference shares | |||
| 2010 | Share split | Voting | 1 for 2 | 117,402,608 | 351,223,879 | 16,120,797 | – | |
| Share split | Non-voting | 1 for 2 | 8,060,398 | 351,223,879 | 24,181,195 | – | ||
| ESOP | Voting | 2,081,508 | 353,305,387 | 24,181,195 | – | |||
| 2011 | Scrip issue for final dividend 2010 | Voting |
_edit-web-resources/image/709.png)
|
Rs. 2.00 per share | 2,277,195 | 355,582,582 | 24,181,195 | – |
| Scrip issue for final dividend 2010 | Non-voting | 255,734 | 355,582,582 | 24,436,929 | – | |||
| ESOP | Voting | 1,457,645 | 357,040,227 | 24,436,929 | – | |||
| Rights issue | Voting | 1 for 14 | 25,502,433 | 382,542,660 | 24,436,929 | – | ||
| Rights issue | Non-voting | 1 for 14 | 1,745,494 | 382,542,660 | 26,182,423 | – | ||
| Share split | Voting | 1 for 1 | 382,542,660 | 765,085,320 | 26,182,423 | – | ||
| Share split | Non-voting | 1 for 1 | 26,182,423 | 765,085,320 | 52,364,846 | – | ||
| 2012 | Scrip issue for final dividend 2011 | Voting |
|
Rs. 2.00 per share | 13,587,144 | 778,672,464 | 52,364,846 | – |
| Scrip issue for final dividend 2011 | Non-voting | 1,108,902 | 778,672,464 | 53,473,748 | – | |||
| ESOP | Voting | 1,341,768 | 780,014,232 | 53,473,748 | – | |||
| 2013 | Scrip issue for final dividend 2012 | Voting |
|
Rs. 2.00 per share | 13,076,189 | 793,090,421 | 53,473,748 | – |
| Scrip issue for final dividend 2012 | Non-voting | 1,069,474 | 793,090,421 | 54,543,222 | – | |||
| ESOP | Voting | 1,445,398 | 794,535,819 | 54,543,222 | – | |||
| 2014 | Scrip issue for final dividend 2013 | Voting |
|
Rs. 2.00 per share | 12,504,344 | 807,040,163 | 54,543,222 | – |
| Scrip issue for final dividend 2013 | Non-voting | 1,036,724 | 807,040,163 | 55,579,946 | – | |||
| ESOP | Voting | 3,237,566 | 810,277,729 | 55,579,946 | – | |||
| 2015 | Scrip issue for final dividend 2014 | Voting |
|
Rs. 2.00 per share | 8,118,773 | 818,396,502 | 55,579,946 | – |
| Scrip issue for final dividend 2014 | Non-voting | 719,740 | 818,396,502 | 56,299,686 | – | |||
| ESOP | Voting | 2,170,613 | 820,567,115 | 56,299,686 | – | |||
| 2016 | Scrip issue for final dividend 2015 | Voting |
|
Rs. 2.00 per share | 11,818,040 | 832,385,155 | 56,299,686 | – |
| Scrip issue for final dividend 2015 | Non-voting | 912,967 | 832,385,155 | 57,212,653 | – | |||
| ESOP | Voting | 1,136,732 | 833,521,887 | 57,212,653 | – | |||
| 2017 | Scrip issue for final dividend 2016 | Voting |
|
Rs. 2.00 per share | 10,521,802 | 844,043,689 | 57,212,653 | – |
| Scrip issue for final dividend 2016 | Non-voting | 903,357 | 844,043,689 | 58,116,010 | – | |||
| Rights issue | Voting | 1 for 10 | 84,649,465 | 928,693,154 | 58,116,010 | – | ||
| Rights issue | Non-voting | 1 for 10 | 5,811,601 | 928,693,154 | 63,927,611 | – | ||
| ESOP | Voting | 3,278,537 | 931,971,691 | 63,927,611 | – | |||
| 2018 | Scrip issue for final dividend 2017 | Voting |
|
Rs. 2.00 per share | 11,998,388 | 943,970,079 | 63,927,611 | – |
| Scrip issue for final dividend 2017 | Non-voting | 1,085,563 | 943,970,079 | 65,013,174 | – | |||
| ESOP | Voting | 1,739,324 | 945,709,403 | 65,013,174 | – | |||
| 2019 | Scrip issue for final dividend 2018 | Voting |
|
Rs. 2.00 per share | 15,249,529 | 960,958,932 | 65,013,174 | – |
| Scrip issue for final dividend 2018 | Non-voting | 1,241,095 | 960,958,932 | 66,254,269 | – | |||
| ESOP | Voting | 293,385 | 961,252,317 | 66,254,269 | – | |||
| 2020 | Scrip issue for final dividend 2019 | Voting |
|
Rs. 2.00 per share | 22,485,434 | 983,737,751 | 66,254,269 | – |
| Scrip issue for final dividend 2019 | Non Voting | 1,716,432 | 983,737,751 | 67,970,701 | – | |||
| Issue of shares via a Private Placement | Voting | 115,197,186 | 1,098,934,937 | 67,970,701 | – | |||
| 2021 | Scrip issue for final dividend 2020 | Voting |
|
Rs. 2.00 per share | 25,071,337 | 1,124,006,274 | 67,970,701 | – |
| Scrip issue for final dividend 2020 | Non Voting | 1,770,070 | 1,124,006,274 | 69,740,771 | – | |||
| ESOP | Voting | 474,254 | 1,124,480,528 | 69,740,771 | – | |||
8. Engaging with shareholders
During the year, the Bank complied with its Shareholder Communication Policy, which outlines the various formal channels through which it engages with shareholders. It covers the timely communication of quarterly performance of the Group and the Bank as set out in the section on Financial Review 2021 in “Summary of Interim Financial Statements - Group and Bank”. It also records significant events that may reasonably be expected to impact the share price. (More details are given in Financial Calendar )
9. Quarterly performance in 2021 compared to 2020 (As per Rule No. 7.4 (a) (i) of the Listing Rules of the CSE)
Despite the challenges faced during the pandemic, the Bank duly submitted the Interim Financial Statements for the year 2021 to the CSE within applicable statutory deadlines. (The Bank duly complied with this requirement for 2020 as well). Please refer “Financial Calendar ” for further details. A Summary of the Income Statement and the Statement of Financial Position depicting quarterly performance during 2021 together with comparatives for 2020 is given in Summary of Interim Financial Statement – Group and Bank in the section on Financial Review 2021 for the information of stakeholders.
The Audited Income Statement for the year ended December 31, 2021 and the Audited Statement of Financial Position as at December 31, 2021 will be submitted to the CSE within three months from the year end, which is well within the required deadline as required by Rule No. 7.5 (a) of the Listing Rules of the CSE. (The Bank duly complied with this requirement for 2020).
This Annual Report in its entirety is available on the Bank’s website both as a PDF file and as well as an interactive version (http://www.combank.lk/newweb/en/investors).
Shareholders may also elect to receive a hard copy of the Annual Report on request. The Company Secretary of the Bank will respond to individual letters received from shareholders based on the requests made through the specimen request letter included in the booklet sent to shareholders.
10. Debt securities
Details of debentures issued and redeemed by the Bank during the year as well as the balances outstanding is as shown in the Table 42 given below:
10.1 Debenture Composition Table – 42
| Fixed Interest Rate | Fixed Interest Rate | |||||||||||
| 2021 | 2020 | |||||||||||
| Type of Issue | Public | Public | Public | Public | Public | Public | Public | Public | Public | Public | Public | Public |
| Debenture Type | Type "B" | Type "B" | Type "A" | Type "B" | Type "A" | Type "B" | Type "A" | Type "B" | Type "A" | Type "B" | Type "A" | Type "B" |
| CSE Listing | Listed | Listed | Listed | Listed | Listed | Listed | Listed | Listed | Listed | Listed | Listed | Listed |
| Issue Date | 9-Mar-16 | 28-Oct-16 | 23-Jul-18 | 23-Jul-18 | 21-Sep-21 | 21-Sep-21 | 9-Mar-16 | 9-Mar-16 | 28-Oct-16 | 28-Oct-16 | 23-Jul-18 | 23-Jul-18 |
| Maturity Date | 8-Mar-26 | 27-Oct-26 | 22-Jul-23 | 22-Jul-28 | 20-Sep-26 | 20-Sep-28 | 8-Mar-21 | 8-Mar-26 | 27-Oct-21 | 27-Oct-26 | 22-Jul-23 | 22-Jul-28 |
| Interest Payable Frequency | Bi-Annually | Bi-Annually | Bi-Annually | Bi-Annually | Bi-Annually | Bi-Annually | Bi-Annually | Bi-Annually | Bi-Annually | Bi-Annually | Bi-Annually | Bi-Annually |
| Offered Interest Rate | 11.25% p.a. | 12.25% p.a. | 12.00% p.a. | 12.50% p.a. | 9.00% p.a. | 9.50% p.a. | 10.75% p.a. | 11.25% p.a. | 12.00% p.a. | 12.25% p.a. | 12.00% p.a. | 12.50% p.a. |
| Amount (Rs. Mn.) | 1,749.09 | 1,928.20 | 8,393.84 | 1,606.16 | 4,237.47 | 4,358.00 | 4,430.34 | 1,749.09 | 5,071.80 | 1,928.20 | 8,393.84 | 1,606.16 |
| Market Values | ||||||||||||
| – Highest (Rs.) | Not traded during the year | Not traded during the year | Not traded during the year | Not traded during the year | Not traded during the year | 102.00 | 100.49 | 100.00 | Not traded during the year | Not traded during the year | Not traded during the year | 100.00 |
| – Lowest (Rs.) | 100.00 | 100.00 | 95.00 | 100.00 | ||||||||
| – Year-end (Rs.) | 102.00 | 100.49 | 95.00 | 100.00 | ||||||||
| Interest Rates | ||||||||||||
| – Coupon Rate (%) | 11.25 | 12.25 | 12.00 | 12.50 | 9.00 | 9.50 | 10.75 | 11.25 | 12.00 | 12.25 | 12.00 | 12.50 |
| – Effective Annual Yield (%) | 11.57 | 12.63 | 12.36 | 12.89 | 9.20 | 9.73 | 11.04 | 11.57 | 12.36 | 12.63 | 12.36 | 12.89 |
| Interest rate of comparable Government Security (%) | 10.67 | 10.86 | 8.45 | 11.32 | 10.65 | 11.42 | 4.70 | 6.75 | 5.00 | 6.80 | 5.95 | 7.15 |
| Other Ratios as at date of last trade | ||||||||||||
| – Interest Yield (%) | N/A | N/A | N/A | N/A | N/A | N/A | 9.80 | 12.43 | N/A | N/A | N/A | 12.49 |
| – Yield to Maturity (%) | N/A | N/A | N/A | N/A | N/A | N/A | 9.86 | 12.37 | N/A | N/A | N/A | 12.50 |
11. Key Shareholder Return Indicators Table – 43
| 2021 | 2020 | |
| Debt equity ratio (%) | 23.74 | 35.51 |
| Net assets value per share (Rs.) | 138.08 | 134.67 |
| Interest cover (Times) | 13.18 | 10.37 |
| Liquid assets ratio (%) (Minimum 20%) | ||
| Domestic Banking Unit | 38.73 | 44.99 |
| Off-shore Banking Unit | 36.39 | 32.70 |
| Liquidity Coverage Ratio (%) | ||
| Rupee | 425.97 | 599.38 |
| All Currency | 242.52 | 422.86 |
| Net Stable Funding Ratio – NSFR (%) | 157.47 | 157.49 |
12. Credit ratings
12.1 National Long-term ratings
Fitch Ratings Lanka Ltd., has revised the National Long-term Rating of the Sri Lankan financial institutions following the recalibration of its Sri Lankan national rating scale. However, Fitch Ratings reaffirmed the National Long-term rating of the Bank at AA-(lka) and its outlook to stable in August 2021.
The Bank’s Bangladesh Operation’s credit rating was reaffirmed at AAA by Credit Rating Information Services Ltd., in June 2021 for the 11th consecutive year.
12.2 Credit ratings – Debentures
The credit rating of the Bank’s Subordinated Debentures was also reaffirmed at A(lka) by Fitch Ratings Lanka Ltd., in September 2021.